Forex Crunch Unfortunately Pessimistic |
- Unfortunately Pessimistic
- GBP/USD Outlook – August 30 – September 3
- NZD/USD Outlook – August 30 – September 3
- AUD/USD Outlook – August 30 – September 3
- USD/CAD Outlook – August 30 – September 3
- EUR/USD Outlook – August 30 – September 3
| Posted: 29 Aug 2010 02:00 AM PDT One of the main issues on the agenda in Jackson Hole is the double dip recession – what are the odds? Here’s part of the debate, and the No. 1 reason to be pessimistic. The National Bureau of Economic Research (NBER) is the official body responsible for determining cycles of growth and recession. On one hand, they see a low chance of this happening:
But wait, they never determined that the recession that began at the end of 2007 ever ended. Mish notes this important point, and explains why he sees contraction in the 3rd and 4th quarters:
Mish takes into account that stimulus will be over, but in the same symposium in Jackson Hole, Bernanke vowed to do everything he can to keep the recovery going. To add to optimism, I found optimistic words from Jamie Coleman, that in September 1992, Time Magazine wrote about how the US economy is in a sorry situation, the longest since the Great Depression. Sounds familiar? In his post titled “It’s Always Darkest Before The Dawn” he goes on to remind us that:
So, are the highly regarded economists at NBER just too slow, and all we need is patience? Perhaps. But there’s one huge issue. Unemployment Never Improved During the Recovery Unfortunately, being optimistic is a difficult task. It’s not only because “Dr. Doom”, Nouriel Roubini, raised the odds of a double dip recession to 40%. It’s the employment. The official unemployment rate is still high, 9.5%. Yes, there’s a delay between economic recovery until employment picks up. It’s usually a 6 month gap. With a year into recovery (the US economy returned to growth in Q3 of 2009), the situation isn’t improving. Weekly unemployment claims and Non-Farm Payrolls are weak, time after time. The official unemployment rate, marked U-3, shows the “Total unemployed, as a percent of the civilian labor force”. But there’s an alternative figure – U-6. U-6 counts the “Total unemployed, plus all persons marginally attached to the labor force, plus total employed part time for economic reasons, as a percent of the civilian labor force plus all persons marginally attached to the labor force” – meaning it also counts discouraged workers who are too desperate to look for a job. The seasonally adjusted figure, by the US Bureau of Labor Statistics (BLS), shows that the real unemployment rate rose from 16.4% in July 2009 to 16.5% in July 2010. So, during all the recovery period, the real unemployment rate remained high and refused to improve. Without an improvement in employment during the “good times”, it’s hard to believe that good times are ahead. Jobs mean consumption – consumption that the US economy is dependent on. What do you think? Want to see what other traders are doing in real accounts? Check out Currensee. It's free.. |
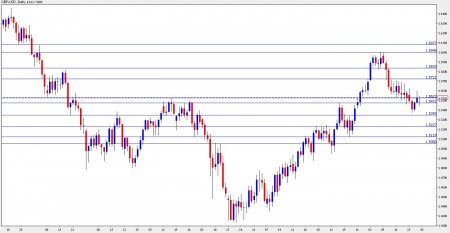
| GBP/USD Outlook – August 30 – September 3 Posted: 28 Aug 2010 10:00 PM PDT The upcoming week is packed with events, with PMI figures in the limelight. Here’s an outlook for the British events, and an updated technical analysis for GBP/USD. GBP/USD daily chart with support and resistance lines marked. Click to enlarge: The Pound dived lower in the past week, but managed to recover, with a boost coming from an upwards revision of GDP for the second quarter. Will it continue higher?
GBP/USD Technical Analysis The British Pound began the week with a significant downfall, first losing the 1.5520 line and quite quickly the 1.5470 line. Both were mentioned in last week’s outlook. The 1.5470 line turned into tough resistance. This was eventually broken, and the pair closed just above 1.5520, at 1.5536 – Another week of retreat for the Pound. GBP/USD ranges between 1.5520, which served as tough resistance in April and as support line in February, to 1.5720, which supported the Pound back in 2009. It’s less strong than in previous weeks. Looking up, 1.5833, which provided support when the year began and later worked as resistance, is the next line. Higher, the psychological round number of 1.60 proved to be a tough barrier in recent weeks and is a strong resistance line. Higher, 1.6080 is the next minor resistance line, after working as support in January. It's followed by 1.6270, but that's quite far at the moment. Looking down below 1.5520, the next line of support is quite close – 1.5470 – it capped the pair just this week. 1.5350 served as pivotal line in March and April and this week’s attempt to break below it makes it strong again. Below, 1.5230 was a stubborn resistance line in July and is now a major support line. Lower, 1.5120 will provide further support. I remain bearish on the Pound. Softer inflation, a new hesitation in job growth,makes the Pound vulnerable in the face of the imminent global slowdown. Further reading:
Want to see what other traders are doing in real accounts? Check out Currensee. It's free.. |
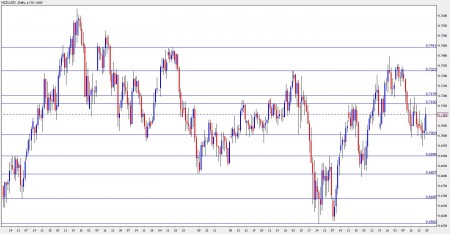
| NZD/USD Outlook – August 30 – September 3 Posted: 28 Aug 2010 05:14 PM PDT 4 events await kiwi traders in the upcoming week, with the business confidence being the highlight. Here’s an outlook for the events in New Zealand and an updated technical analysis for NZD/USD. NZD/USD daily chart with support and resistance lines marked. Click to enlarge: The kiwi saw tensed range trading in the past week and didn’t make dramatic moves. This week should provide more action, after the summer vacation is over. Let’s start:
NZD/USD Technical Analysis During most of the week, NZD/USD traded between 0.70 and 0.71. A dip under 0.70 was short-lived, and a rise on Friday lost air towards the 0.7160 resistance line (mentioned in last week’s outlook). The kiwi finally closed at 0.7106. The pair continues to range between 0.70, the round number that is a strong line of support, and 0.7160 which was a stubborn peak in June. Looking down, 0.69 is the next line of support. It previously worked as a line of resistance in May, after the pair fell down sharply. Below, 0.68, that was a swing low in mid-July and also held NZD/USD in February is the next support line. Lower, 0.6685 worked as support back in September and was a pivotal line in July. The final line for now is the year-to-date low of 0.6560. Above 0.7160, the next resistance line is 0.72 that worked as support quite recently. Higher, 0.7325 that was an area of struggle and also a peak in May is the next line of resistance, followed by the 0.7440 region, which capped the pair when it traded higher. I remain bearish on NZD/USD. As the chances of double-dip recession in the US seem strong, risk aversive trading hurts the kiwi. As the last big release from New Zealand was the very disappointing rise in unemployment, the pair isn’t well positioned to weather the storm. Further reading:
Want to see what other traders are doing in real accounts? Check out Currensee. It's free.. |
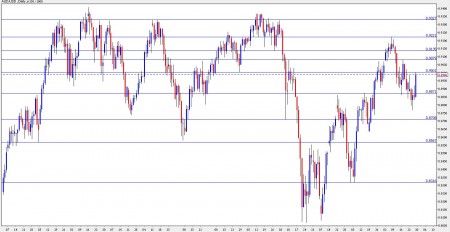
| AUD/USD Outlook – August 30 – September 3 Posted: 28 Aug 2010 12:35 PM PDT A very busy week expects Aussie traders, with GDP and 12 other events to rock the currency, that still shakes by the election results. Here’s an outlook for the Australian events and an updated technical analysis for AUD/USD. AUD/USD daily chart with support and resistance lines marked. Click to enlarge: The elections ended in a hung parliament. This political uncertainty, together with weak private capital expenditure, hurt the Australian dollar. The echoes from the elections – whether a government is formed or new elections are called, will continue affecting the Aussie, alongside the many indicators, and also Bernanke’s speech in Jackson Hole. Let’s start:
AUD/USD Technical Analysis After the Aussie started lower on a weekend gap, it manged to climb towards 0.90 (mentioned in last week’s outlook), but political uncertainty sent it down again, below the 0.8870 line. A late recovery sent the Aussie to close at 0.8986. The Aussie now trades between the round psychological number of 0.90 that capped it in the past week, and 0.8870, which is now only a minor support line. Below, 0.8710, which was a swing low a few months ago is the next line of support. It’s followed by the veteran 0.8567 support line, which began its role back in 2009. Lower, the double bottom in July, 0.8316, serves as the next support line. Even lower, the year-to-date low of 0.8066 is the ultimate support line. Looking up above 0.90, the next line is 0.9080 which capped the pair in July and in mid-August. Higher, 0.9135 supported the pair in April and now works as resistance. Above, 0.9220 was also a support line in April and held the pair a few weeks ago. Even higher, 0.9327 began its role in autumn 2009 and capped the pair many times since then. I return to being bullish on the Aussie. The dust from the elections has settled. It seems that a government will be eventually formed. The Australian economy is doing quite well, and the influx of fresh data should support rises. Further reading:
Want to see what other traders are doing in real accounts? Check out Currensee. It's free.. |
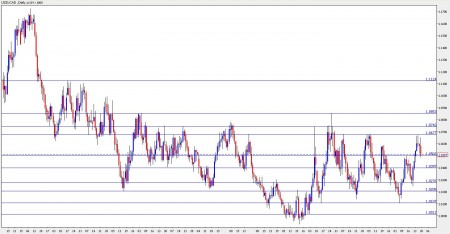
| USD/CAD Outlook – August 30 – September 3 Posted: 28 Aug 2010 09:00 AM PDT The Canadian dollar expects another rather calm week, but with one key event to rock it – GDP. Here’s an outlook for the Canadian events and an updated technical analysis for USD/CAD, now on higher ground. USD/CAD daily chart with support and resistance lines marked. Click to enlarge: Weak retail sales and the growing notion of a double dip recession in Canada’s main trade partner – the US, hurt the Canadian dollar. Will it recover? Let’s start:
USD/CAD Technical Analysis The Canadian dollar had a bad start to the week – USD/CAD broke above the 1.05 resistance line (mentioned in last week’s outlook) and challenged the 1.0680 twice. Towards the end of the week, USD/CAD dropped and closed just above the 1.05 line. Looking up, the 1.0680 line became a stronger line of resistance after being tested twice in the past week. It was also a stubborn resistance line at the beginning of July. Above, the 1.0750 line was the top border of long term resistance line, and also a swing high in May. Another swing high in May, the 1.0850 line, serves as the next line of resistance, after working as such back in 2009 as well. Above, the next significant line is rather far – 1.1130, which capped the pair back in 2009. It’s quite far now. Looking down, 1.04 is a veteran line of support and resistance, and currently works as support. Below, the 1.0280 proved to be rather strong in recent months, and is the next line of support. Lower, the 2009 low 1t 1.02 serves as the next line of support. Lower, 1.01 capped the pair after it reached parity in April, and also was a low point a few weeks ago. The ultimate line of support is parity – which seems far now. I turn neutral on USD/CAD. The Canadian economy cannot keep pushing forward as its main trade partner is still behind. Recent retail sales showed it. While the situation is still OK in Canada, more range trading seems likely at the moment. Further reading:
Want to see what other traders are doing in real accounts? Check out Currensee. It's free.. |
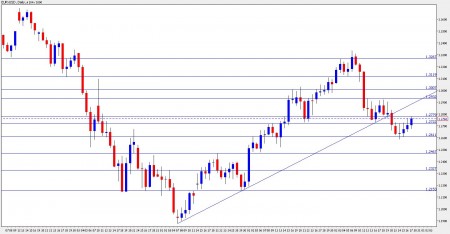
| EUR/USD Outlook – August 30 – September 3 Posted: 28 Aug 2010 06:00 AM PDT The calendar is packed for the Euro in the upcoming week, with the rate decision being the highlight. Here’s an outlook for European events and an updated technical analysis for the ranging EUR/USD. EUR/USD daily chart with support and resistance lines marked. Click to enlarge: Echoes from the downwards revision of US GDP and also from Bernanke’s speech in Jackson Hole will still move the pair at the beginning of the week. Later, the news will start shaping trading. Let’s start:
EUR/USD Technical Analysis The Euro started the week in a weak tone, dropping to the 1.2610 support line mentioned in last week’s outlook. It later gradually recovered, managed to cross the 1.2722 line peaked just under 1.2780 before closing at 1.2760. All in all, the Euro rose 60 pips after a tight week of range trading. The current range is between the important 1.2722 support line and the minor 1.2780 line that capped the pair in the past week. Higher, the 1.2930 that was a stubborn resistance line in recent weeks provides further resistance. Above, the round number of 1.30 is the next line of resistance, mostly due to its psychological role. Higher, the 1.3110 line served as a line of resistance and later as support during July, and is now a strong barrier. Even higher, 1.3267 is the next resistance line, working as a support line many times in the past. It’s also important to note the long term uptrend line which switched from support to resistance two weeks ago. It will stand between 1.2950 and 1.30 during the week. A break above this diagonal line will be a bullish sign. Looking down below 1.2722, the next line of resistance is the 1.2610 line which capped the pair in July and worked just now as a strong line of support. Lower, 1.2460 held the pair when it was trading lower, in May and in June. Below, the “Lehman levels” – lows of 2008, continue to provide minor support. A strong line of support appears at 1.2150, which worked as a very strong line of support, and briefly as resistance. Lower, the round number of 1.20 is the next line of support, before the year-to-date low of 1.1876. I remain bearish on EUR/USD. The gloomy mood in the markets is still strong, and a double dip recession in the US can hurt the Euro. Also the Euro zone is vulnerable to the austerity measures taken by the member countries. After range trading in these summer days, the new month’s figures, with the Non-Farm Payrolls, can provide significant price action. This pair receives excellent reviews on the web. Here are my favorites:
Further reading:
Want to see what other traders are doing in real accounts? Check out Currensee. It's free.. |
| You are subscribed to email updates from Forex Crunch To stop receiving these emails, you may unsubscribe now. | Email delivery powered by Google |
| Google Inc., 20 West Kinzie, Chicago IL USA 60610 | |

No comments:
Post a Comment