Forex Crunch GBP/USD Outlook – August 23-27 |
- GBP/USD Outlook – August 23-27
- NZD/USD Outlook – August 23-27
- USD/CAD Outlook – August 23-27
- AUD/USD Outlook – August 23-27
- EUR/USD Outlook – August 23-27
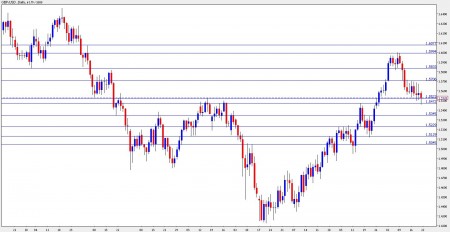
| GBP/USD Outlook – August 23-27 Posted: 21 Aug 2010 10:00 PM PDT A relatively light week expects cable traders, yet the GDP release will definitely create waves for quite some time. Here’s an outlook for the British events, and an updated technical analysis for GBP/USD. GBP/USD chart with support and resistance lines marked. Click to enlarge: While inflation slides gradually back into target, there’s still one member that wants a rate hike. For now, he remains the only member. An upgrade of the GDP could change the minds of others. Let’s start:
GBP/USD Technical Analysis The British Pound performed impressive range trading during most of the week, trading between the major support line of 1.5520 and the minor resistance line of 1.5720, all mentioned in last week’s outlook. By the end of the week, the global weakness took over and GBP/USD dropped to test the 1.5472 line, but managed to escape it and to close just above 1.5520. The Pound now trades between 1.5520, which served as tough resistance in April and as support line in February, to 1.5720, which supported GBP/USD back in 2009. Above, 1.5833, which provided support when the year began and later worked as resistance, is the next resistance line. Higher, the round psychological number of 1.60 proved to be a tough barrier not so long ago and is a very strong resistance line. Higher, 1.6080 is the next minor line of resistance, after serving as support in January. It's followed by 1.6270, but that's quite far at the moment. Looking down below 1.5520, the next line of support is quite close – 1.5470 – it capped the pair in its recent ascent and supported the pair just this Friday. 1.5350 served as pivotal line in March and April and now provides minor support. Lower, 1.5230 was a stubborn resistance line in July and is now a major support line. Even lower, 1.5120 will provide further support. I turn bearish on GBP/USD. The past week’s range trading is over with the Pound being more vulnerable now. A break under 1.5470 will trigger more weakness, especially as inflation softens and the excellent GDP in Q2 could be revised to the downside. Further reading:
Want to see what other traders are doing in real accounts? Check out Currensee. It's free.. |
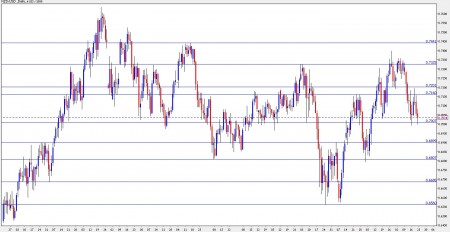
| NZD/USD Outlook – August 23-27 Posted: 21 Aug 2010 06:05 PM PDT The release of inflation expectations is the highlight of this week’s kiwi indicators. Here’s an outlook for the kiwi in the upcoming week. NZD/USD chart with support and resistance lines marked. Click to enlarge: On one hand, producer prices rose more than expected, boosting the kiwi on expectations for fresh rate hikes. On the other hand, the global slowdown, led by Ben Bernanke, reduced the demand for “high risk” currencies such as the New Zealand dollar. The result – NZD/USD eventually closed the week very closed to where it ended the previous one. Let’ see what’s up now:
NZD/USD Technical Analysis The kiwi enjoyed the risk rally at the beginning of the week and it made move from the support line of 0.70 (mentioned in last week’s outlook) through the 0.7160 and up to 0.72 before bouncing back down all the way. Like last week, the pair is bound between the round number of 0.70 and 0.7160 which temporarily held the pair in the past week, and also beforehand. Below, 0.69 is the next support line. It previously worked as a line of resistance in May, after the pair fell down sharply. Lower, 0.6790 that was a swing low in mid-July and also held NZD/USD in February is the next support line. Below, 0.6685 worked as support back in September and was a pivotal line in July. The final line for now is the year-to-date low of 0.6560. Above, 0.7160 provides minor resistance, and its followed by 0.72 that worked as support quite recently. Higher, 0.7325 that was an area of struggle and also a peak in May is the next line of resistance, followed by the 0.7440 region, which capped the pair when it traded higher. I remain bearish on NZD/USD. After the disappointing quarterly employment data, the kiwi is more vulnerable than others to the gloomy market mood. Further reading:
Want to see what other traders are doing in real accounts? Check out Currensee. It's free.. |
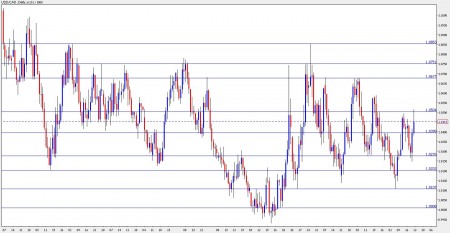
| USD/CAD Outlook – August 23-27 Posted: 21 Aug 2010 01:59 PM PDT Loonie traders expect a calm week in terms of Canadian events. Here’s an outlook for these events and an updated technical analysis for USD/CAD. USD/CAD chart with support and resistance lines marked. Click to enlarge: Most indicators were weak last week – foreign cash flows squeezed significantly, wholesale sales shrunk, and Core CPI unexpected dropped, reducing the chance of a rate hike in the near term. All this hurt the Canadian dollar. Will the loonie recover now? Let’s start:
USD/CAD Technical Analysis The Canadian dollar had a good start to the week, with USD/CAD dropping towards the 1.0280 support line. It later went up, struggling around the 1.04 line, and almost breaching the 1.05 line – all were mentioned in last week’s outlook. At 1.0453, USD/CAD is now in a range between 1.04, which worked as a long-term support line and also as a line of resistance in the past year, and 1.05, which became a strong resistance line after capping the pair in the past week. Looking down, the 1.0280 is the next strong line of support, holding the pair from falling int he past week, repeating this role from a few months ago. It’s followed by the 2009 low of 1.02 which also worked in both directions, also after the pair reached parity. Lower, 1.01 worked as a support line at the beginning of August and is a minor line of support. The last line is the ultimate parity line – 1.01. Looking up, 1.0680 was a stubborn line of resistance for four days at the beginning of July. Higher, 1.0750 was the top border of a long-term range, and was also tested in the month of May. Above, 1.0850 provided the last line of resistance when the pair leaped in May, and was also a swing high in 2009. Above this line, there’s only the far line of 1.1130. I am bearish on USD/CAD. Canadian fundamentals are still strong enough to weather the global storm caused by Ben Bernanke. The pair should stabilize this week and prepare for another assault on parity later on. Further reading:
Want to see what other traders are doing in real accounts? Check out Currensee. It's free.. |
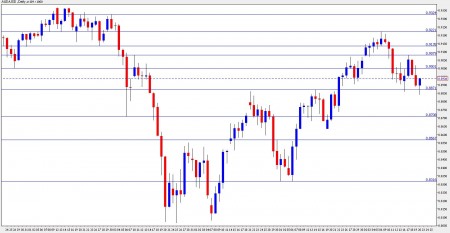
| AUD/USD Outlook – August 23-27 Posted: 21 Aug 2010 10:37 AM PDT The upcoming week consists of three market moving events in Australia, as well as political echoes after the elections ended in a hung parliament. Here’s an outlook for these events and an updated technical analysis for AUD/USD. AUD/USD chart with support and resistance lines marked. Click to enlarge:
The meeting minutes and RBA governor Glenn Stevens in particular, hinted that there’s still lots of time for more rate hikes. This, together with the echoes from Ben Bernanke’s statement, hurt the Aussie. Now, the elections and other events will rock the currency. Let’s start:
AUD/USD Technical Analysis The Aussie started the week with a ounce off the 0.8870 level mentioned in last week’s outlook. It later struggled with the 0.90 line, managed to cross it, but couldn’t breach the 0.9080 line. The fall was strong and almost ended in losing 0.8870, but the pair finally closed at 0.8938. AUD/USD now ranges between 0.8870, which served as a clear line in both directions, and the round number of 0.90, which provides minor resistance. Above, 0.9080 proved itself once more in the past week, and is now a major line of resistance. Higher, 0.9135 supported the pair when it was trading higher, and recently worked as resistance. Above, 0.9220 capped the Australian dollar at the beginning of the month and also supported it in April – it’s a strong resistance line. The veteran 0.9327 line is still far in the distance. Looking down below 0.8870, the next line of support is at 0.8710, which was a swing low in May and also provided support later on. It’s followed by 0.8567, which worked as support in May and as a resistance line back in 2009. Even lower, 0.8316 was a double bottom in July, and provides major resistance. Lower, the year-to-date low of 0.8066 is the ultimate support line. I am bearish on the Aussie this week. There are no major fundamentals that can lift the pair this week (such as employment figures), and the global gloomy mood also play against the Australian dollar. Add the federal elections in Australia that left the country with a hung parliament and you get the bears on the move. This political uncertainty will hurt the Aussie, at least at the beginning of the week. Further reading:
Want to see what other traders are doing in real accounts? Check out Currensee. It's free.. |
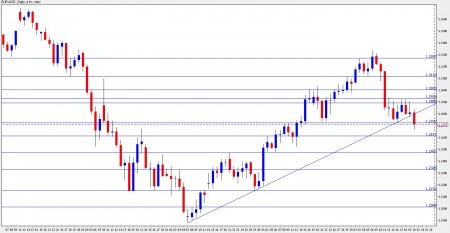
| EUR/USD Outlook – August 23-27 Posted: 21 Aug 2010 06:00 AM PDT After losing the uptrend support line, another busy week expects Euro traders, with many important surveys due this week. Here’s an outlook for the 9 events that will shape the Euro’s trading, and an updated technical analysis for EUR/USD, now at lower ground. EUR/USD chart with support and resistance lines marked. Click to enlarge: The economic sentiment in Europe continues to deteriorate, but there are also good signs that show the end of the debt crisis. The gloomy mood took over at the end of the week, as EUR/USD lost a long term uptrend support line. Which mood will take control this week? Let’s start:
EUR/USD Technical Analysis The Euro touched base with the 1.2722 support line at the beginning of the week, and then stayed away from it, ranging between 1.2770 and 1.2930 during most of the week. And then, on Friday, a sharp fall sent the pair below the long term uptrend support and below the 1.2722 support line. After bottoming out at 1.2663, EUR/USD closed at 1.2707. EUR/USD now trades between the aforementioned 1.2722 line and 1.2610, which was a minor resistance line in May and in July. Note that some lines have changed since last week’s outlook. Looking down, the next line of support is already more significant – 1.2460 served as a resistance line and later as a support line in several occasions. Below, the “Lehman levels” of 1.2330 provide further minor support. Lower, 1.2150 is a very strong line of support – it held the pair firmly in May and later in July. Even lower, the round psychological number of 1.20 provides further support. Looking up, the 1.2880 provides weak immediate resistance above 1.2722. Higher, the past week’s highs of 1.2930 provide more serious support. Higher, the round number of 1.30 is the next line of support, and it’s followed by 1.3110, which worked as a clear line of support and later as resistance, and is a strong hurdle. The last resistance line is 1.3267, which also worked in both directions. It’s important to stress that the long term uptrend support line extending from June 7th up to August 20th has been clearly broken. I remain bearish on EUR/USD. Bernanke’s groundbreaking statement about global slowdown, the notion that the Euro-party is over and the clear break of the last long term uptrend support, draw a conclusion that more drops are awaiting down the road. This pair receives excellent reviews on the web. Here are my favorites:
Further reading:
Want to see what other traders are doing in real accounts? Check out Currensee. It's free.. |
| You are subscribed to email updates from Forex Crunch To stop receiving these emails, you may unsubscribe now. | Email delivery powered by Google |
| Google Inc., 20 West Kinzie, Chicago IL USA 60610 | |

No comments:
Post a Comment